Introducing Conversion Funnels
If you have a business, you have a funnel. That’s the set of steps a customer has to go through to convert your visitors into customers. If you’re an e-commerce store, your funnel has steps like viewing a product and adding it to a shopping cart. If you offer memberships, your funnel might extend past the signup to steps like logging in and using specific features of your service.
Whatever that funnel is, you can now start optimizing it with Improvely. The new Conversion Funnel report is here, and it makes visualizing and drilling into your funnels a snap.

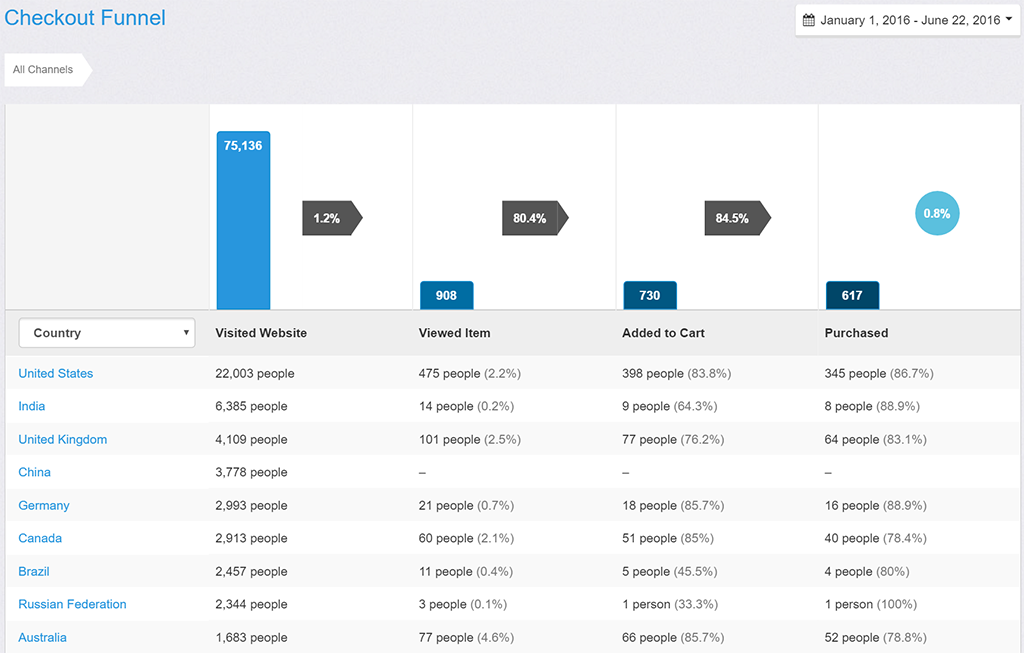
You can build a custom funnel that visualizes the steps customers in your specific business need to complete, and it’ll populate with data instantly. You don’t have to pre-define funnels before collecting data like some platforms. You’ll be able to tell at a glance where your potential customers are dropping off, and identify these holes in your funnel that need extra attention to maximize conversion.
Each step in your funnel is visualized with a column chart, with arrows showing the percentage of people from each step that completed the one following. Under the chart, you can segment your traffic by all the dimensions you’re familiar with from our other reports — channel, source, campaign, medium, ad content, referrer, landing page, keyword, device type and location.
The funnel report is a new feature available in all plans today.
